
Gantt Chart
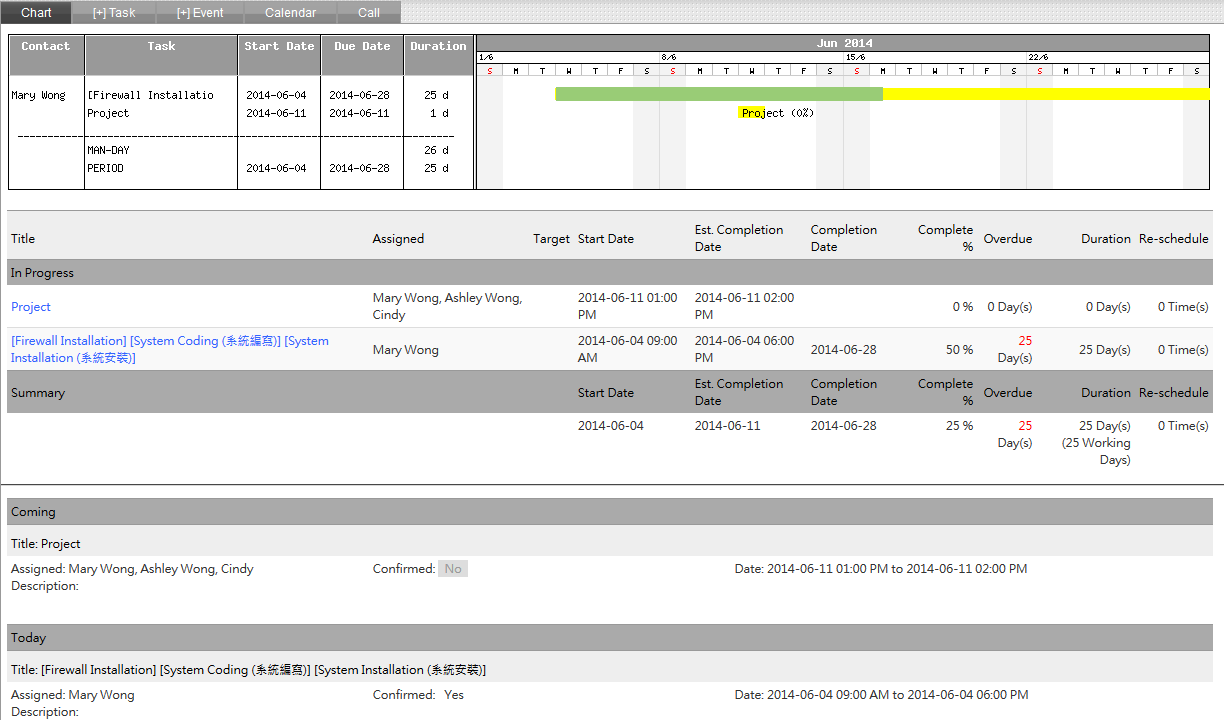
Gantt chart is a type of bar chart that illustrates a project schedule, the start and finish dates of
the terminal elements and summary elements of a project, which comprises the work breakdown
structure of the project.
Gantt charts shows the dependency (i.e. precedence network) relationships between activities, and
can be used to show current schedule status using percent-complete shadings and a vertical "TODAY"
line. This allows team members to see how long the project took them to finish, the percentage of
completion, days overdue etc., to better estimate and manage company resources.