
Gantt Chart
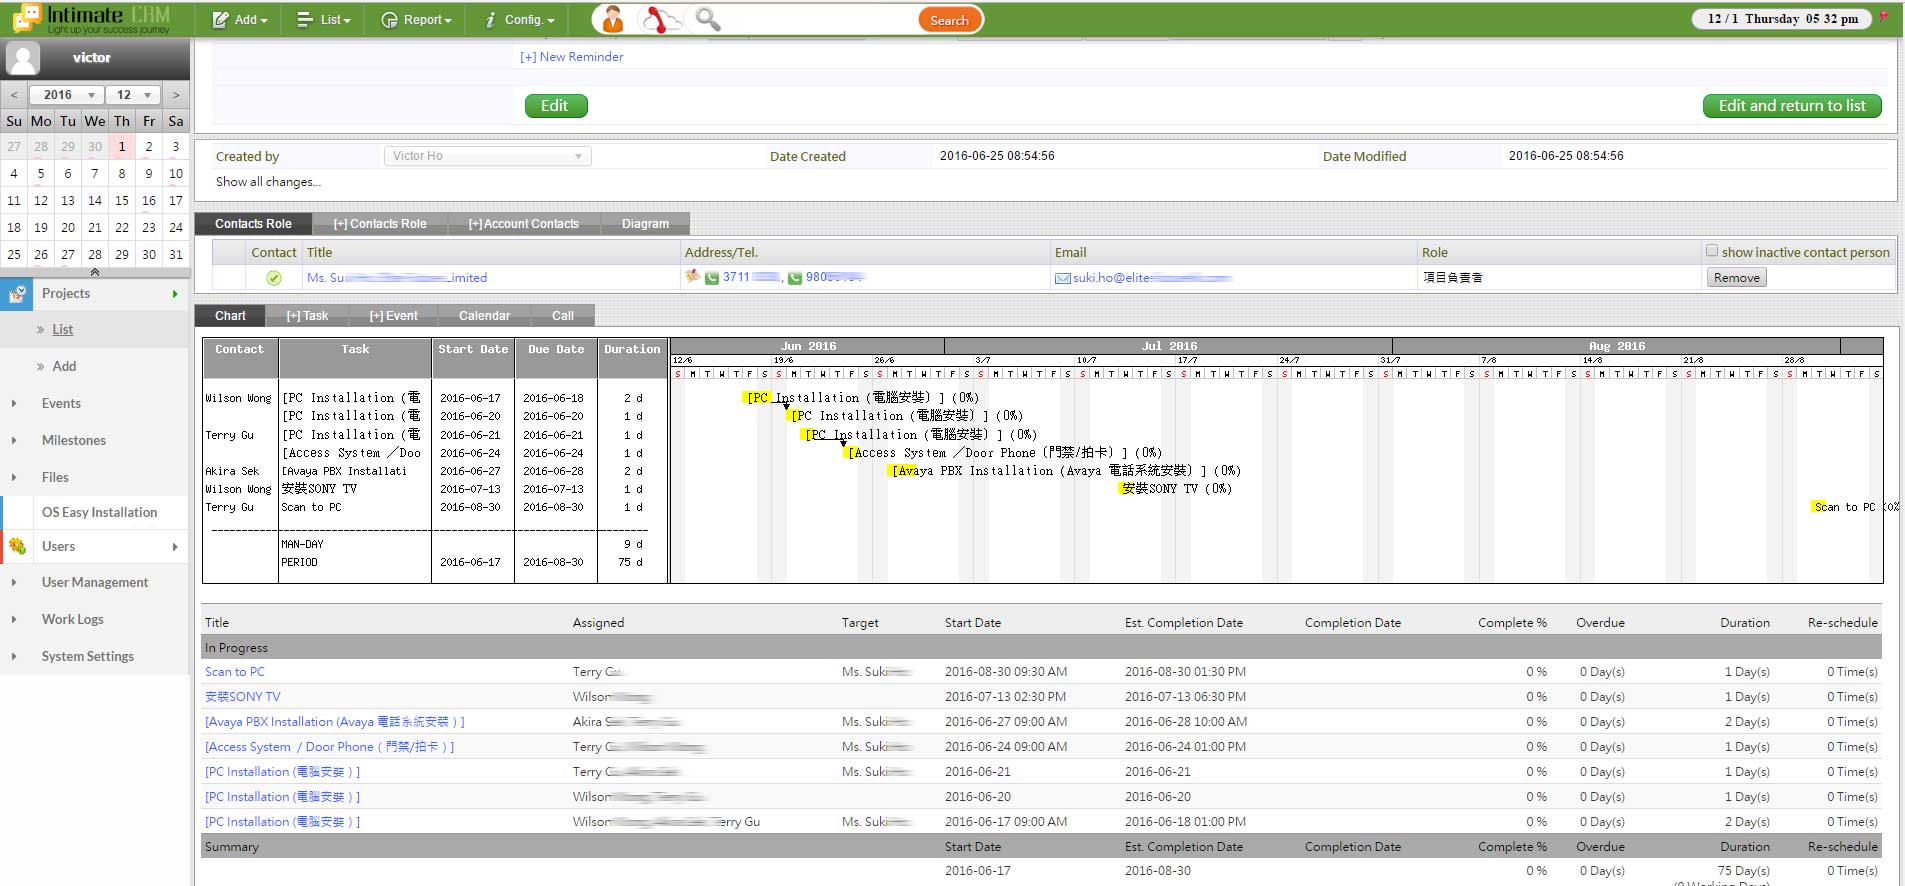
The Gantt Chart will illustrate the commencement and completion dates of all the tasks of a project, and you can also find the work breakdown structure of the project.
Moreover, the assignee and the duration of each task, as well as the percentage of completion for every task, will be shown on the Gantt chart.
Therefore, you can estimate the throughput time, cycle time and throughput rate of each task, as well as finding the bottleneck of a project.